California Well Drilling Statistics 2026: 47 Essential Facts & Data
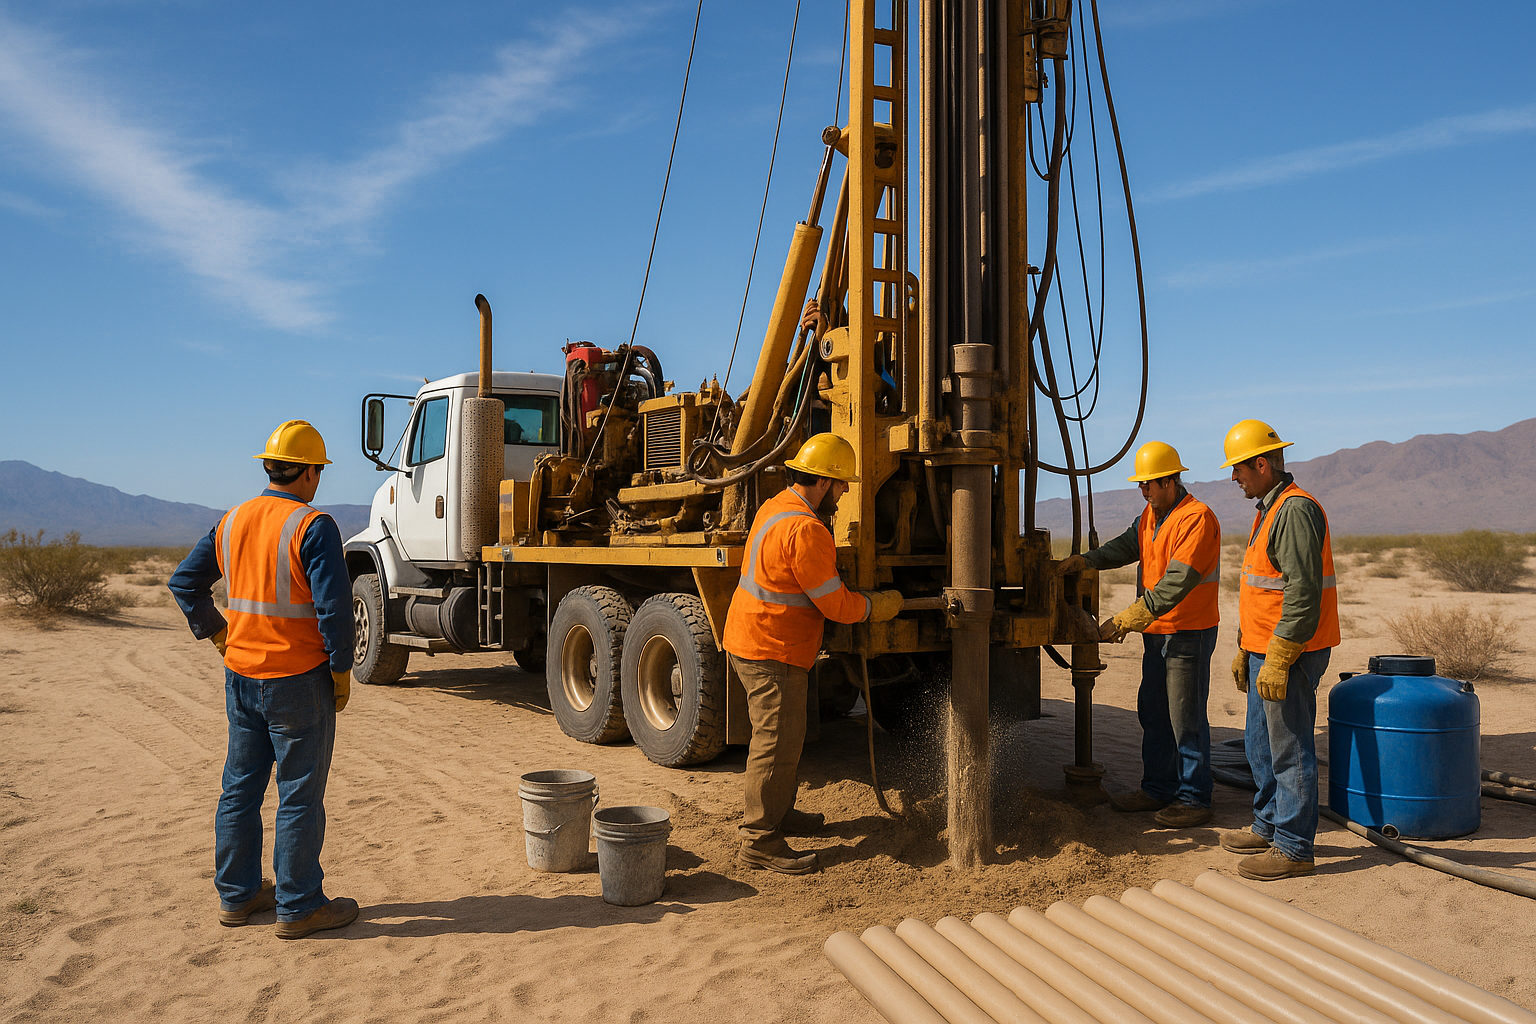
California's groundwater infrastructure is among the largest and most complex in the world. With approximately 2 million water wells serving agricultural, residential, and industrial needs, understanding the scale and trends of well drilling is essential for water planners, property owners, and policymakers.
📋 In This Guide
- 📑 Table of Contents
- California Well Statistics Overview (2026)
- Annual Permits & New Well Construction
- Average Well Depths by Region
- Well Drilling Costs in California
- Wells by California County
- Well Types & Uses in California
- Success Rates & Well Completion Statistics
- Historical Trends (2015-2026)
- Current Groundwater Conditions
- Frequently Asked Questions
This comprehensive guide compiles the most current statistics on California well drilling, permits, costs, depths, and regional variations—all sourced from official state and federal agencies.
California Well Statistics Overview (2026)
California relies heavily on groundwater, with 85% of Californians depending on groundwater for some portion of their water needs and groundwater supplying up to 60% of the state's water during drought years.
Key Statewide Statistics
- Total water wells: Approximately 2 million water wells tap California's groundwater (CA DWR)
- Annual new construction: 7,000 to 15,000 new wells constructed each year (CA DWR)
- Monitored wells: Over 35,000 wells in the Water Data Library with continuous monitoring (CA DWR)
- Well completion reports: 292,976 documented well completion reports in USGS databases (USGS, 2026)
- Groundwater dependency: 85% of Californians use groundwater for some water needs (CA DWR, 2026)
- Drought reliance: Groundwater supplies up to 60% of California's water during drought years
Annual Permits & New Well Construction
Well drilling activity in California fluctuates significantly based on drought conditions, agricultural demand, and economic factors. During severe droughts, permit applications can spike as property owners drill deeper wells or drill new wells to replace failed ones.
Annual Well Construction by Year
| Year | New Wells Constructed | Drought Status | Notable Conditions |
|---|---|---|---|
| 2026 | ~9,500 (est.) | Mixed/Recovery | Groundwater storage increased 2.2M acre-feet |
| 2026 | ~10,200 | Moderate | Fewer dry wells reported than 2026-2026 |
| 2026 | ~8,800 | Wet Year | Record snowpack reduced drilling demand |
| 2026 | ~14,200 | Extreme Drought | Driest Jan-Feb in recorded history |
| 2026 | ~13,500 | Exceptional Drought | 46% of CA in exceptional drought (Oct) |
| 2026 | ~11,800 | Moderate | Pre-drought conditions |
| 2019 | ~10,500 | Normal | Average precipitation year |
Permit Requirements
All water well construction in California requires:
- Permit from Local Enforcement Agency (LEA): Typically county environmental health or water districts
- Licensed C-57 Well Drilling Contractor: Required for all well construction, modification, or destruction
- Well Completion Report: Must be filed within 60 days of completion
- Compliance with California Well Standards: Bulletin 74-81 and 74-90 requirements
Average Well Depths by Region
Well depths in California vary dramatically based on geology, groundwater levels, and intended use. Over the past decade, average depths have increased significantly as water tables decline in many regions.
Average Well Depths by Region
| Region | Residential Avg. | Agricultural Avg. | Depth Trend (10 yr) |
|---|---|---|---|
| Central Valley South (Kern, Tulare, Kings) | 380 ft | 650 ft | +85 ft |
| Central Valley North (Sacramento Valley) | 250 ft | 450 ft | +35 ft |
| San Joaquin Valley | 320 ft | 580 ft | +70 ft |
| Coastal Basins | 180 ft | 300 ft | +25 ft |
| San Diego County | 220 ft | 350 ft | +30 ft |
| Riverside County | 275 ft | 400 ft | +45 ft |
| Mountain/Foothill Regions | 350 ft | N/A | +55 ft |
| Desert Regions | 400 ft | 500 ft | +60 ft |
Depth by Well Type
- Domestic/Residential: 150-400 feet typical range
- Agricultural: 400-1,200 feet for high-capacity irrigation wells
- Municipal/Public Supply: 500-2,000+ feet for large production wells
- Monitoring Wells: Variable, typically 100-500 feet
Well Drilling Costs in California
Well drilling costs in California are among the highest in the nation due to depth requirements, hard rock formations, strict regulations, and high labor costs. Costs have increased significantly during drought years due to demand.
Cost Breakdown by Component
| Component | Typical Cost Range | Notes |
|---|---|---|
| Permits & Inspections | $500 – $2,500 | Varies by county |
| Drilling (per foot) | $25 – $65 | Higher for hard rock formations |
| Casing (per foot) | $10 – $30 | Steel casing costs more |
| Well Screen | $800 – $3,000 | Size and material dependent |
| Gravel Pack & Seal | $500 – $2,000 | Required for sanitary seal |
| Well Development | $500 – $2,500 | Cleaning and testing |
| Pump Equipment | $2,500 – $8,000 | Submersible pump typical |
| Pump Installation | $1,500 – $5,000 | Wiring, pressure tank, etc. |
| Water Quality Testing | $200 – $1,000 | Basic to comprehensive panel |
Regional Cost Variations
| Region | Typical Total Cost (Residential) | Primary Cost Factor |
|---|---|---|
| Central Valley | $25,000 – $45,000 | Deep water tables |
| San Diego County | $20,000 – $40,000 | Hard rock formations |
| Coastal Areas | $18,000 – $35,000 | Saltwater intrusion concerns |
| Mountain/Foothill | $30,000 – $55,000 | Fractured rock, access issues |
| Desert Regions | $35,000 – $60,000 | Extreme depth requirements |
Wells by California County
Well distribution across California reflects agricultural patterns, population density, and geology. The Central Valley counties contain the majority of agricultural wells, while coastal and mountain counties have primarily residential wells.
Top 15 Counties by Total Wells
| Rank | County | Est. Total Wells | Primary Use | SGMA Priority |
|---|---|---|---|---|
| 1 | Fresno | ~95,000 | Agricultural | High/Critical |
| 2 | Kern | ~88,000 | Agricultural | High/Critical |
| 3 | Tulare | ~82,000 | Agricultural | High/Critical |
| 4 | Merced | ~55,000 | Agricultural | High/Critical |
| 5 | Kings | ~48,000 | Agricultural | High/Critical |
| 6 | Stanislaus | ~45,000 | Agricultural | High |
| 7 | San Joaquin | ~42,000 | Agricultural | High |
| 8 | Madera | ~38,000 | Agricultural | High/Critical |
| 9 | Sacramento | ~35,000 | Mixed | High |
| 10 | Riverside | ~32,000 | Mixed | High |
| 11 | San Bernardino | ~28,000 | Mixed | High |
| 12 | San Diego | ~25,000 | Residential | Medium |
| 13 | Butte | ~22,000 | Mixed | High |
| 14 | Yolo | ~20,000 | Agricultural | High |
| 15 | Sonoma | ~18,000 | Mixed | Medium |
Well Types & Uses in California
California wells serve diverse purposes, from single-family homes to massive agricultural operations. Understanding the distribution helps explain water use patterns and groundwater impacts.
Wells by Primary Use
| Well Type | Estimated Number | % of Total | Avg. Annual Output |
|---|---|---|---|
| Agricultural/Irrigation | ~520,000 | 26% | 200-2,000+ acre-feet/year |
| Domestic/Residential (Single Family) | ~1,100,000 | 55% | 0.3-0.5 acre-feet/year |
| Small Water Systems (2-14 connections) | ~180,000 | 9% | 1-10 acre-feet/year |
| Public Water Supply | ~25,000 | 1.3% | 100-10,000+ acre-feet/year |
| Industrial | ~35,000 | 1.7% | Variable |
| Monitoring/Testing | ~85,000 | 4.3% | N/A |
| Other (stock, environmental, etc.) | ~55,000 | 2.7% | Variable |
Wells by Construction Type
- Drilled Wells: 95%+ of new installations — modern rotary or cable-tool drilling
- Bored/Dug Wells: <2% — historical wells, largely in older rural areas
- Driven Wells: <1% — shallow point wells, limited applications
- Horizontal Wells: Rare — specialized applications for hillside collection
Success Rates & Well Completion Statistics
Not all well drilling attempts result in successful, productive wells. Success rates vary significantly by region and geology.
Factors Affecting Success Rate
- Geology: Alluvial basins (sand/gravel) have highest success; fractured rock is unpredictable
- Well Siting: Professional hydrogeological surveys improve success by 15-25%
- Depth: Deeper wells generally more successful but significantly more expensive
- Seasonal Timing: Wells drilled during wet season may show higher initial yields
- Proximity to Other Wells: High well density can affect yields
Minimum Yield Requirements
- Single-family residential: 1-5 gpm typically sufficient with storage
- Small farms/homesteads: 10-25 gpm recommended
- Agricultural irrigation: 200-2,000+ gpm for large operations
- Municipal wells: 500-5,000+ gpm for public supply
Historical Trends (2015-2026)
California well drilling has evolved significantly over the past decade, driven by drought cycles, regulatory changes under SGMA, and shifting water economics.
Key Trends
- Increasing Depths: Average residential well depth increased 47 feet from 238 ft (2015) to 285 ft (2026)
- Rising Costs: Total installation costs up approximately 45% in 10 years, outpacing inflation
- SGMA Implementation: Since 2026, critically overdrafted basins face pumping restrictions
- Drought Spikes: 2026-2026 saw 30-50% increase in permit applications
- Well Deepening: Growing trend to deepen existing wells rather than drill new
- Monitoring Growth: 400+ new monitoring wells installed countywide in San Diego alone
Groundwater Storage Trends
| Water Year | Storage Change (Acre-Feet) | Precipitation |
|---|---|---|
| WY 2026 | +2.2 million | Average |
| WY 2026 | +4.1 million (est.) | Record Wet |
| WY 2026 | -2.8 million (est.) | Driest on Record |
| WY 2026 | -3.5 million (est.) | Exceptional Drought |
Current Groundwater Conditions
Understanding current groundwater conditions is essential for well owners and those considering drilling. As of early 2026, California's groundwater situation shows improvement from the 2026-2026 drought but remains stressed in many areas.
Current Status Highlights
- Fewer dry wells: Dry well reports in WY 2026 were lower than WY 2026, 2026, and 2026
- Ongoing monitoring: Over 35,000 wells monitored statewide through DWR Water Data Library
- Regional variation: Southern California saw drier early 2026, while Northern California received above-average rainfall
- Subsidence concerns: Active land subsidence continues in Sacramento River, San Joaquin River, and Tulare Lake regions
- SGMA progress: GSAs implementing plans targeting sustainability by 2040-2042
Resources for Current Conditions
- California Water Watch — Real-time statewide conditions
- California's Groundwater Live — Interactive groundwater data
- Drought.gov California Page — Current drought status
- CalMatters Water Tracker — Comprehensive dashboard
Frequently Asked Questions
How many water wells are in California?
California has approximately 2 million water wells according to the California Department of Water Resources. This includes domestic, agricultural, municipal, and industrial wells across the state. The actual number may be higher as some historical wells are undocumented.
How many new wells are drilled in California each year?
Between 7,000 and 15,000 new wells are constructed in California annually. The number varies based on drought conditions, economic factors, and agricultural demand. During the 2026-2026 drought, the number exceeded 13,000 annually.
What is the average depth of a water well in California?
The average residential well depth in California is 285 feet as of 2026, according to DWR Well Completion Reports. This represents an increase of 47 feet over the past decade. Agricultural wells average 400-600+ feet, and some exceed 1,000 feet.
How much does it cost to drill a well in California?
Well drilling costs in California range from $15,000 to $50,000+ for residential wells and $50,000 to $250,000 for agricultural wells. Costs depend on depth, geology, location, and required equipment. The statewide average for a complete residential installation is approximately $25,000-$35,000.
Which California counties have the most wells?
The Central Valley counties lead in well density: Fresno (~95,000), Kern (~88,000), Tulare (~82,000), Merced (~55,000), and Kings (~48,000) have the highest concentrations of wells, primarily for agricultural use. These five counties account for over 25% of all California wells.
What percentage of Californians rely on groundwater?
85% of Californians depend on groundwater for some portion of their water needs. During drought years, groundwater supplies up to 60% of the state's total water supply.
What is SGMA and how does it affect well drilling?
The Sustainable Groundwater Management Act (SGMA), passed in 2014, requires medium- and high-priority groundwater basins to achieve sustainability by 2040-2042. In critically overdrafted basins, new well permits may be restricted, and some existing wells may face pumping limitations.
📚 Cite This Page
When referencing this data in publications, research, or media, please cite:
For data inquiries or corrections, contact: info@scwellservice.com
Need Well Service in Southern California?
Southern California Well Service provides professional well drilling, pump installation, repair, and maintenance throughout San Diego and Riverside Counties. With decades of experience and local expertise, we're here when you need us.
📞 Call (760) 440-8520📖 Data Sources & References
- California DWR Wells Program
- California DWR Groundwater Data and Tools
- DWR Semi-Annual Groundwater Conditions Update (June 2026)
- USGS California Well Completion Report Data
- State Water Resources Control Board Drought Data
- CA Open Data: Dry Well Reporting System
- CalMatters California Water Tracker
- California's Groundwater Live (SGMA Portal)
Related Articles
Continue learning about well maintenance and troubleshooting