Aquifer Depletion Statistics 2026: 45 Facts & Data
U.S. Aquifer Depletion Overview
Source: USGS Groundwater Depletion in the United States
National Depletion Statistics
| Metric | Value |
|---|---|
| Total depletion since 1950 | ~1,000 km³ |
| Annual depletion rate (2010-2020) | ~25 km³/year |
| Depletion rate acceleration | 3x since 1950 |
| States with significant depletion | 40+ |
| Major aquifers in decline | 30+ |
Key Facts
- Depletion has tripled since 1950 due to irrigation expansion
- Most depletion irreversible on human timescales (centuries to recover)
- Half of depletion concentrated in High Plains and California
- Climate change expected to accelerate depletion
- $2 billion/year economic losses from depletion-related issues
Major Aquifer Depletion
Most Depleted U.S. Aquifers
| Aquifer | Depletion | Decline Rate | Status |
|---|---|---|---|
| High Plains (Ogallala) | ~330 km³ | 1-3 ft/year | Critical |
| Central Valley, CA | ~150 km³ | 2-10 ft/year | Critical |
| Mississippi Embayment | ~70 km³ | 0.5-2 ft/year | Declining |
| Atlantic Coastal Plain | ~50 km³ | 0.5-1 ft/year | Moderate |
| Arizona Basin & Range | ~45 km³ | 1-4 ft/year | Active mgmt |
Ogallala Aquifer Statistics
- Extent: 174,000 square miles across 8 states
- Depletion: 30% of original volume lost
- Kansas: Some areas 60% depleted
- Texas Panhandle: 50% saturated thickness lost
- Recharge rate: 0.5-1 inch/year (vs. 15-20 inches pumped)
- Time to recovery: Estimated 6,000+ years natural recharge
California Depletion
Source: California DWR SGMA
Central Valley Statistics
| Metric | Value |
|---|---|
| Total depletion since 1960 | ~150 km³ |
| Annual overdraft | 2-3 million acre-feet |
| Drought-year overdraft | 5+ million acre-feet |
| San Joaquin Valley decline | Up to 100+ feet since 1960 |
| Critically overdrafted basins | 21 |
SGMA Critically Overdrafted Basins
- Kern County Subbasin
- Tulare Lake Subbasin
- Tule Subbasin
- Kaweah Subbasin
- Kings Subbasin
- Westside Subbasin
- Delta-Mendota Subbasin
- Chowchilla Subbasin
- Madera Subbasin
- Borrego Valley
- ... and 11 others
Land Subsidence
Source: USGS California Land Subsidence Program
Subsidence Statistics
| Location | Total Subsidence | Rate |
|---|---|---|
| San Joaquin Valley (max) | 28 feet | Historical |
| San Joaquin Valley (recent) | 0.5-2 ft/year | Active |
| Houston, TX | 10+ feet | Managed |
| Phoenix, AZ | 18+ feet | Historical |
| Las Vegas, NV | 6+ feet | Managed |
Subsidence Impacts
- Infrastructure damage: Roads, bridges, canals, pipelines
- Reduced aquifer capacity: Permanent storage loss
- Flooding risk: Lowered land elevations
- Well damage: Casing collapse, reduced capacity
- California canal damage: Billions in repairs needed
Depletion Impacts
Well Owner Impacts
- Deeper wells required: 50-200+ feet deeper over time
- Increased pumping costs: 2-3x higher energy bills
- Dry wells: Thousands of domestic wells have gone dry
- Well deepening costs: $15,000-50,000 typical
- New well costs: 25-40% higher than a decade ago
Environmental Impacts
- Stream depletion: Reduced baseflow to rivers
- Ecosystem loss: Wetlands and springs drying
- Seawater intrusion: Coastal aquifer contamination
- Water quality decline: Concentration of contaminants
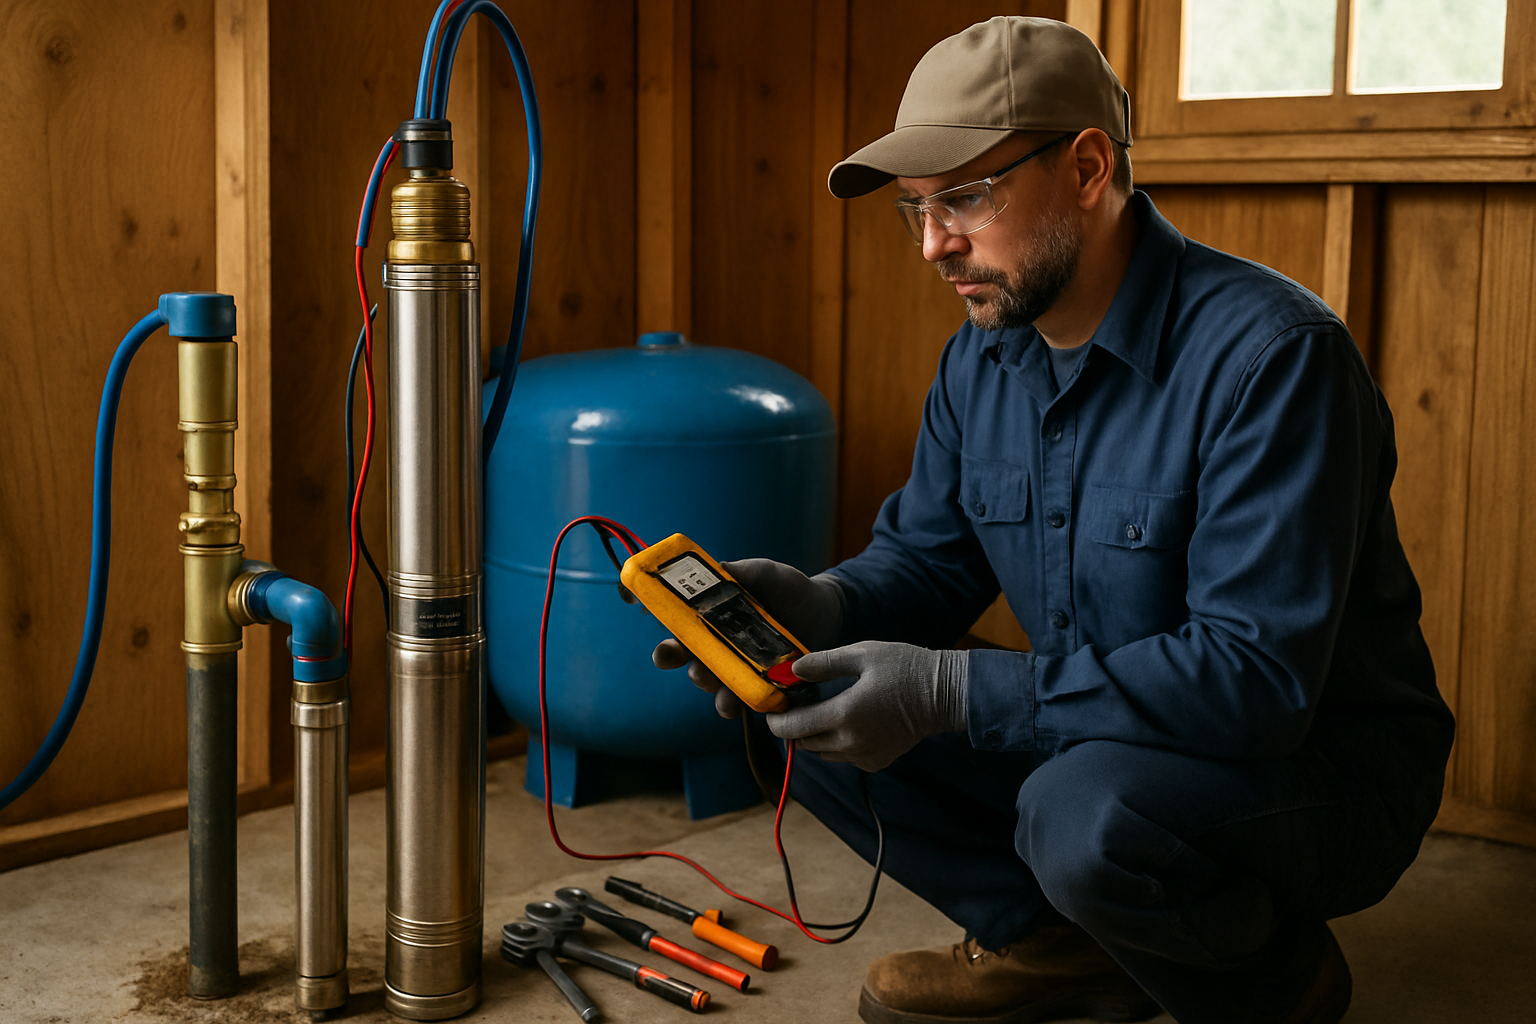
We service all major pump brands including Franklin Electric, Grundfos, Goulds (Xylem), and Sta-Rite (Pentair). Our trucks carry common parts and components for same-day repairs.
Frequently Asked Questions
How much groundwater has been depleted?
Since 1950, approximately 1,000 cubic kilometers (270 trillion gallons) has been depleted from U.S. aquifers.
What is the most depleted aquifer?
The High Plains (Ogallala) Aquifer has lost approximately 330 km³ since 1950, with some areas 50-60% depleted.
How fast are aquifers declining?
Rates vary from 1-3 feet/year in the Ogallala to 5-10 feet/year in California during droughts.
What is groundwater overdraft?
Overdraft occurs when pumping exceeds natural recharge. California has 21 critically overdrafted basins.
Can depleted aquifers recover?
Some can recover over decades with reduced pumping, but compacted aquifers suffer permanent storage loss.
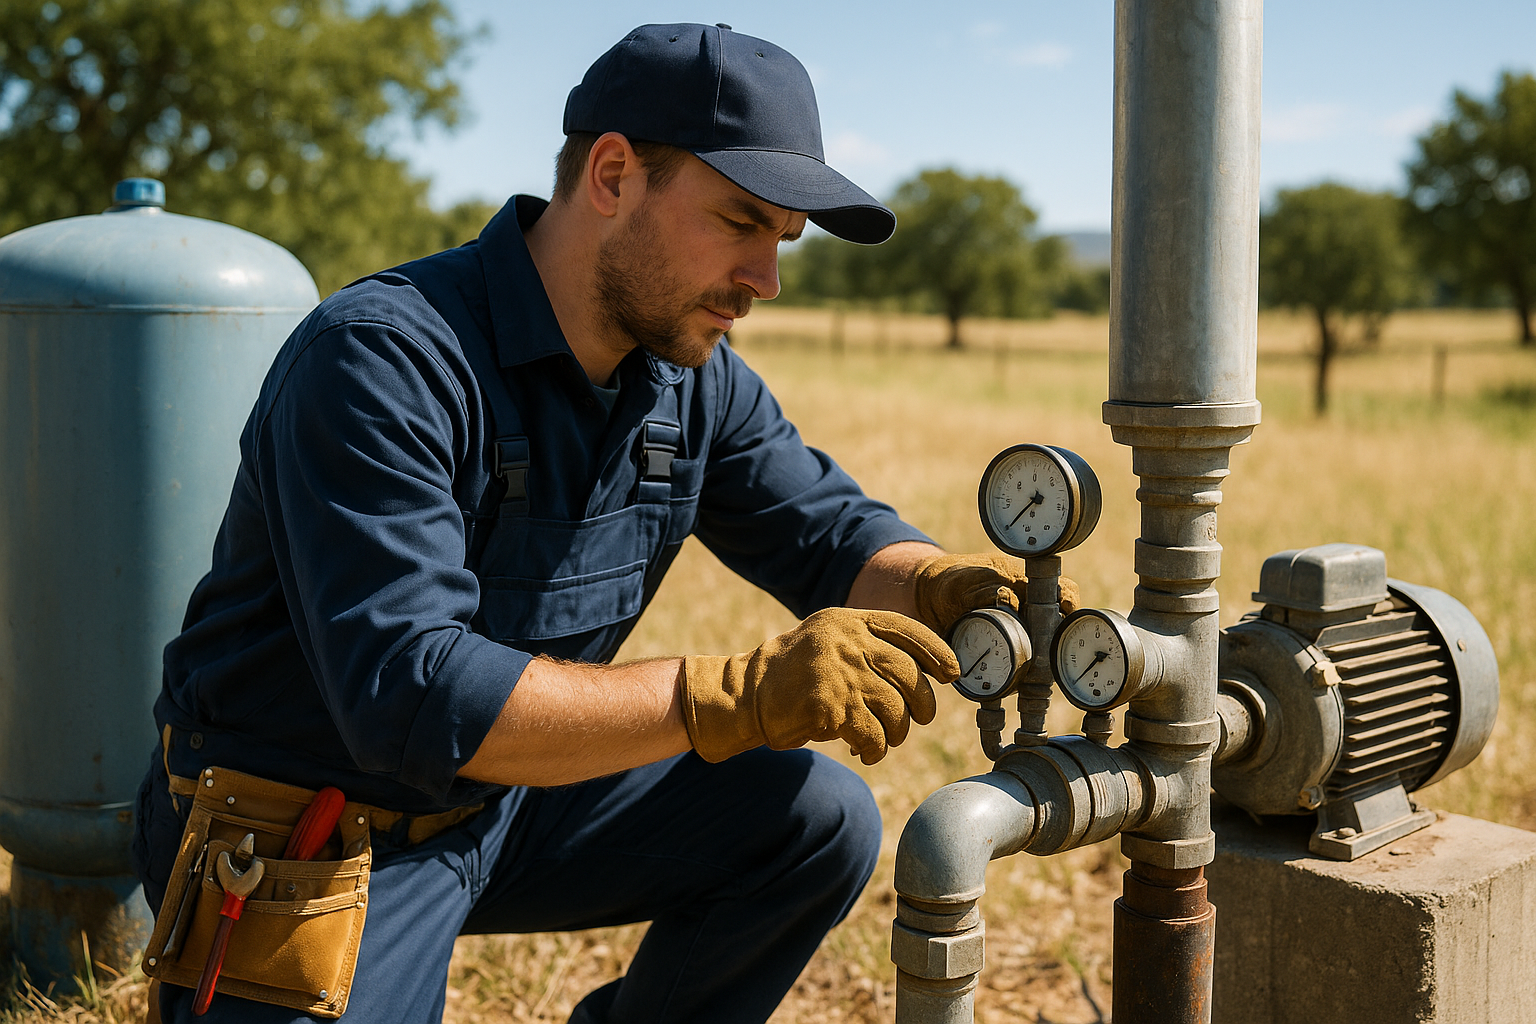
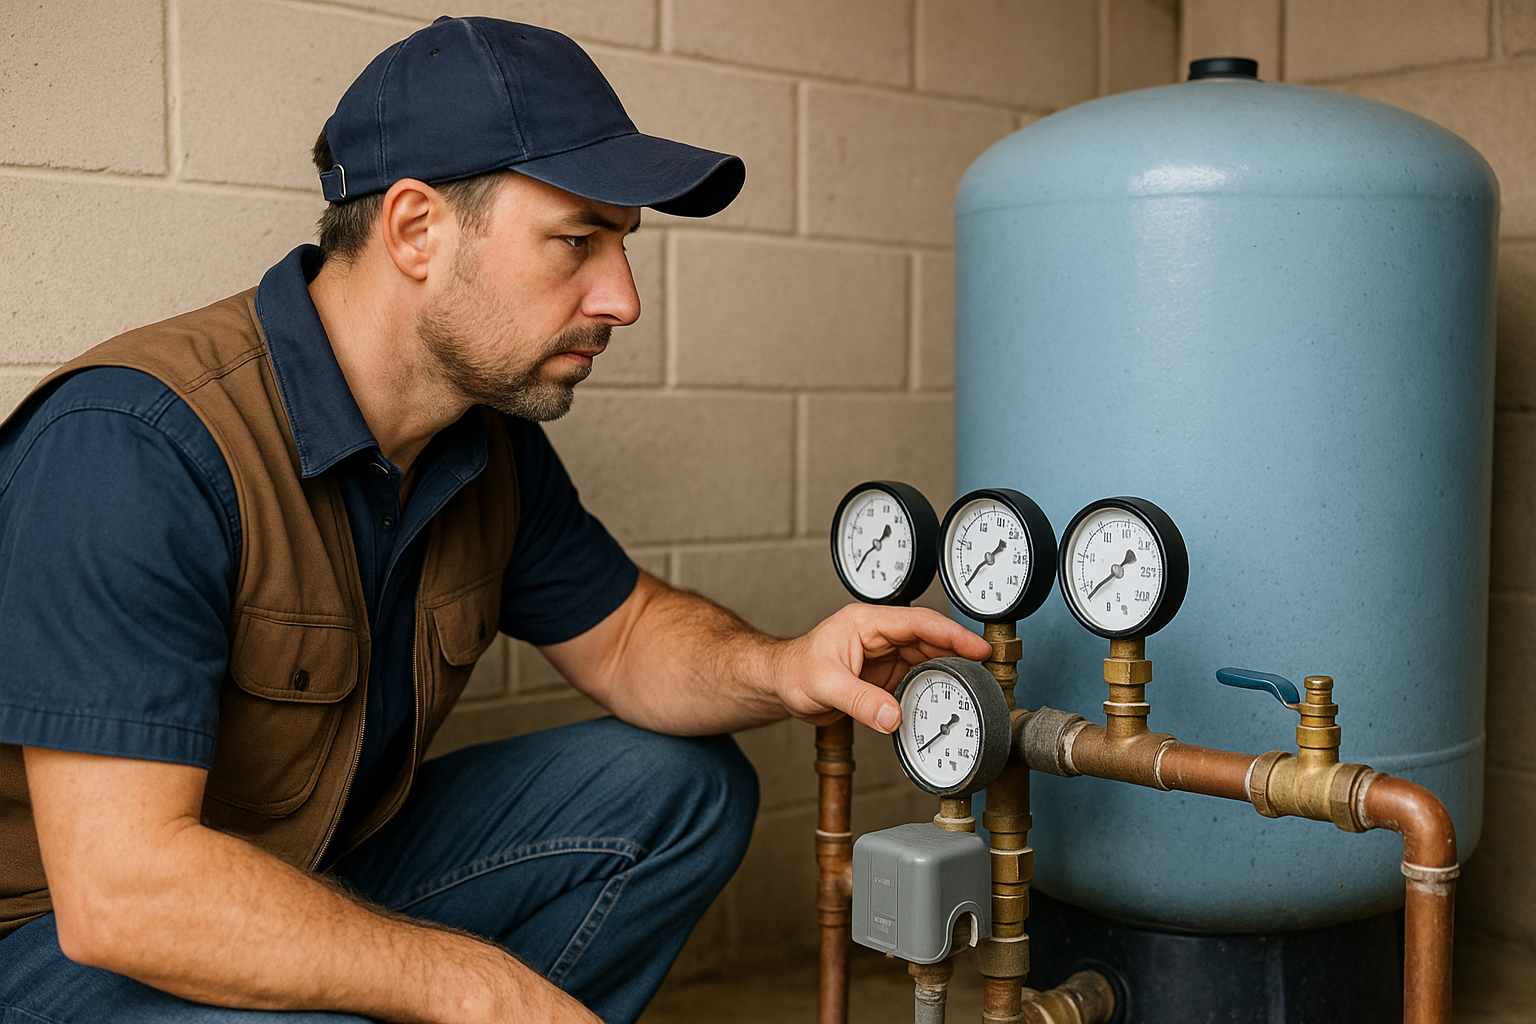
Concerned About Your Well?
See our well assessment services for yield testing and solutions.
Call us: (760) 440-8520
Related Articles
Continue learning about well maintenance and troubleshooting