Groundwater Recharge Statistics 2026: 38 Facts & Data
3-4M
MAR AF/Year (US)
500+
CA Recharge Projects
$150/AF
Avg Recharge Cost
20-25M
AF Annual Deficit
Groundwater Recharge Overview
3-4 Million Acre-FeetAnnual managed recharge in the United States
Source: USGS, AWWA, State water agencies
Natural Recharge Rates
| Region | Recharge Rate |
|---|---|
| Eastern Humid | 10-25 in/year |
| Midwest | 5-15 in/year |
| High Plains | 0.5-3 in/year |
| Southwest | 0.1-2 in/year |
| California | 1-10 in/year |
| Pacific NW | 8-20 in/year |
Managed Aquifer Recharge
MAR Statistics
| Metric | Value |
|---|---|
| US MAR capacity | ~5 million AF/year |
| Actual recharge | 3-4 million AF/year |
| California projects | 500+ |
| CA annual recharge | 1.5+ million AF |
| Arizona water banking | 4+ million AF stored |
Recharge Methods
- Spreading basins: 60% of MAR
- Injection wells: 25% of MAR
- In-lieu/agricultural: 10%
- Other methods: 5%
Recharge Costs
| Method | Cost per AF |
|---|---|
| Spreading basins | $50-300 |
| Injection wells | $200-800 |
| In-lieu recharge | $100-400 |
| Stormwater capture | $500-2,000 |
Frequently Asked Questions
What is natural recharge rate?
Natural recharge ranges from 0.5-3 in/year in arid areas to 10-25 in/year in humid regions.
How much is recharged through MAR?
US MAR projects add approximately 3-4 million acre-feet annually.
Is recharge keeping up with pumping?
No, extraction exceeds recharge by 20-25 million acre-feet annually in many basins.
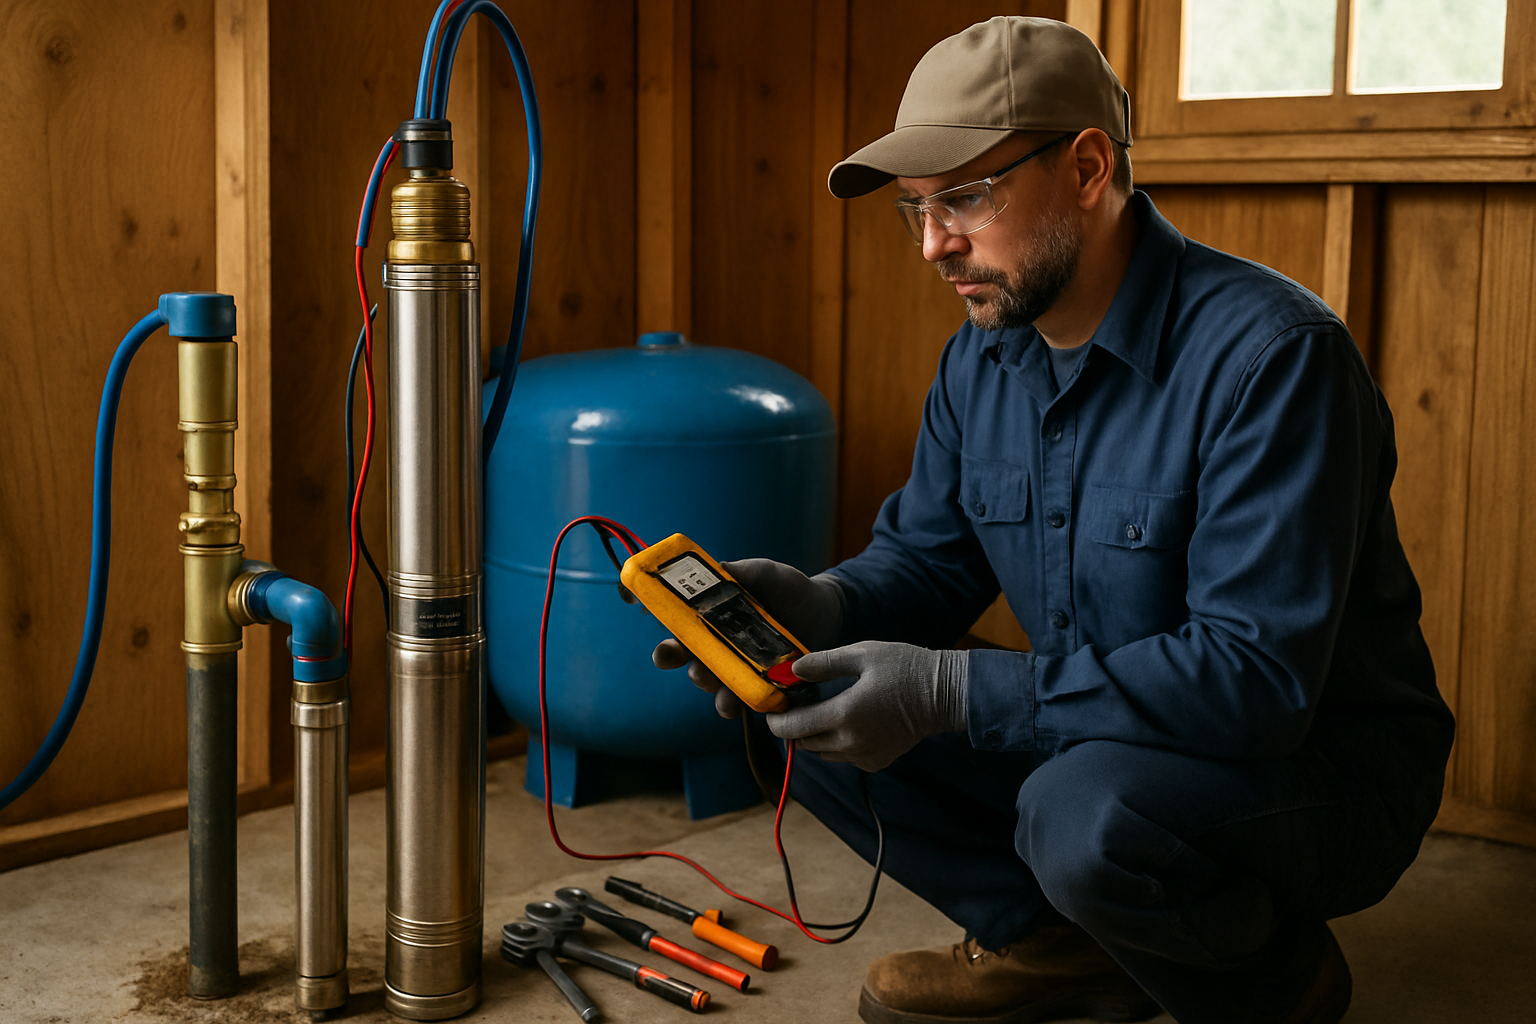
Need Well Services?
Southern California Well Service provides well drilling and pump services.
Call: (760) 440-8520
Related Articles
Continue learning about well maintenance and troubleshooting